Elevate the power of your work
Get a FREE consultation today!
A Partnership with the Norman B. Leventhal Map & Education Center

A Partnership with the Norman B. Leventhal Map & Education Center
Iron Mountain announces our partnership with the Norman B. Leventhal Map & Education Center for their exhibition America Transformed: Mapping the 19th Century, which will be accessible from May 2019-May 2020. The full year exhibit will have two different parts, both with the core themes of paying tribute to the land, economy, transportation and people.
Founded in 2004 in a public-private partnership between the Boston Public Library and philanthropist Norman Leventhal, the Norman B. Leventhal Map & Education Center is a nonprofit with the mission to use the collection of over 200,000 maps to educate people across the country. This grant given by Iron Mountain is part of our Living Legacy Initiative, our charitable commitment to preserving and making accessible historical and cultural information and assets.
Crozier, an Iron Mountain business dedicated to the stewardship and preservation of fine art and cultural artifacts, is pleased to have contributed to this project. Tom Hale, Senior Vice President and General Manager of Crozier North America, commented: "We are thrilled to lend our expertise to the Norman B. Leventhal Map & Education Center in helping them bring together America Transformed: Mapping the 19th Century. This partnership demonstrates our resolve to protecting the value and integrity of the world's finest collections and forwards our educational mission."
The exhibition will feature two parts: The U.S. Pushes Westward 1800-1862 (May to November of 2019), and Homestead to Modern Cities: 1862-1900 (November 2019 to May 2020). The U.S. Pushes Westward 1800-1862 begins with the 1800 Anglo-American settlers who explored and surveyed lands inhabited by Native Americans as well as French and Spanish settlers. Moreover, this exhibit pays homage to the dispossession of native lands in hopes to further the education about colonialism and displacement. After the first exhibit, Homestead to Modern Cities: 1862-1900 will focus on the more modern development including that of cities paying special attention to the influences placed by the steam boat, railroad, and immigrant labor pool. Moreover, this second part of the exhibit touches on the expansion of farmland and the discovery of metals such as iron, gold, and silver. It also focuses on the expansion of western territories and the creation of American cities like Chicago and urban life.
"America Transformed: Mapping the 19th Century tells an epic story of a century of our nation's dramatic change. It has been in the making with over three years of intense research, writing and design, and features over a hundred maps from our collection and lenders across the country," said Connie Chin, President of the Norman B. Leventhal Map and Education Center. "We are thrilled to be in partnership with Iron Mountain and the Boston Public Library to bring this story to thousands of people of all ages and backgrounds."
Also created will be educational programs, reaching 400,000 students. Programs will help teachers create development programs, and further the education of students so they all learn about the displacement of indigenous people. This exhibit aims to move beyond the traditional "wild west" myths and use the over 120 maps, photographs, books, objects and interactive displays to explore the complex dynamics that have shaped the United States while centering Native Americans and focusing on government involvement.
The Leventhal Map & Education Center is committed to education and has over 100 lesson plans available for teachers and development programs scheduled throughout the year. They are one of the top ten map museums in the U.S for its size and collection.
"With this new exhibition, people can learn how maps document the transformation of America's 19th century landscape and examine how that transformation continues to shape our lives today. The way our landscape has changed, both physically and culturally, is striking," said Leventhal curator Rom Grim. "The installation challenges us with different perspectives on the United States' westward expansion, among them the parallel story of indigenous peoples' losses, often through violent means. It is my hope that visitors come away with a better understanding of the complexity of our nation's history."
James T.B. Ives (1839-1915)
Historical Map Showing the Successive Acquisitions of Territory by the United States of America
New York, 1896. Mechanical map, 24.5 x 34 inches. Courtesy of Barry MacLean Collection.
Mechanical Map
The boundaries of the United States transformed during the 19th century. Mapmaker James Ives created this mechanical map to help people, especially students, visualize these changes. The top map labels the tribes that occupied different regions, while the lower layers represents the territorial growth of the United States. The mechanized pieces of this cartographic puzzle include the colonies in 1776, the Louisiana Purchase in 1803, and the Gadsden Purchase in 1853. The map told a story of the seemingly inevitable process of expansion and emphasized nation-building by treaties rather than the violence of war.
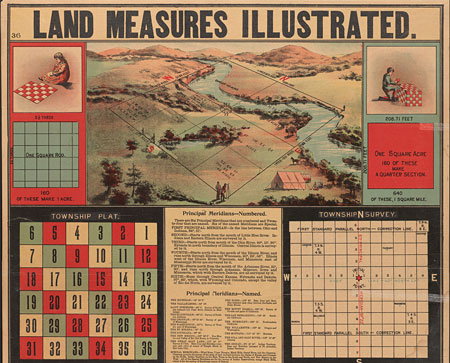
Diamond Publishing Co.
Land Measures Illustrated
Minneapolis, 1901. Broadside, 41 x 27.5 inches. Leventhal Map and Education Center.
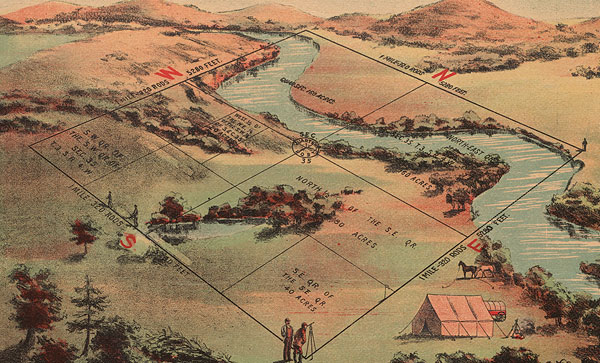
This educational poster illustrates several mathematical issues, including the structure of the General Land Office township surveys. The top scene depicts surveyors laying out a single section, measuring one mile by one mile and containing 640 acres. The diagram labeled "Township Plat" demonstrates the division of a township into 36 sections, while the "Township Survey" diagram explains that townships are identified in relation to a base line and meridian (representing an X-Y axis). Each parcel of land has a unique numerical identifier such as the 40-acre tract where the surveyors stand would be identified as the SE 1/4 of the SE 1/4 of Section 1, Township 4 South, Range 5 East, of the 6th Principal Meridian.
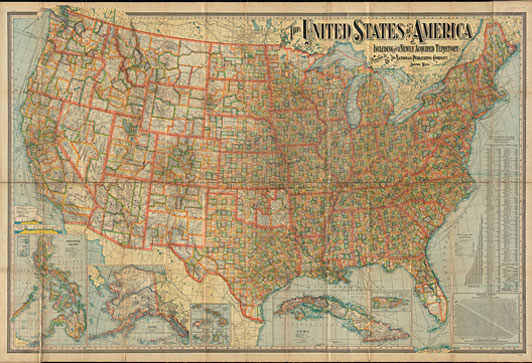
National Publishing Company
The United States of America: Including All Its Newly Acquired Territory
Boston, 1902. Printed map, 38 x 55 inches. Leventhal Map and Education Center. Reproduction 2019.
Territorial Expansion Beyond the Continental Boundaries
While this information-packed map summarizes the nation's political geography and population growth after a century of territorial expansion and native removals, it also documents a new arena for empire building beyond the continent. Brightly colored boundaries outline 48 states and organized territories, as well as counties within each. Settlement in the eastern half of the country was denser than the West, which was characterized by much larger states and counties. Graphs and tables demonstrate the growth of population from 3.9 million in 1790 to over 76 million in 1900. Marginal insets depict Alaska and Hawaii (taken by a coordinated overthrow of the Hawaiian Queen just a few year prior), as well as "newly acquired territories" in the Caribbean and across the Pacific.
Get a FREE consultation today!